Liquid Crystal Segmentation
Published:
This is an interesting project for my undergraduate thesis. It shows a possible application for deep learning models on physics. I will briefly review what I have done in this project.
Automated Segmentation for Liquid Crystal Microscopy
Liquid Crystals (LC) provide a versatile platform for sensing of air contaminants (chemical sensing) and sensing of heat transfer and shear stress (mechanical sensing) (Smith et al. (2020)). The detection of a LC sensor is relied on a microscopy image such as the one shown above. We can simply find positive areas in each small regular grids and calculate the ratio of positive response. Although generally lighter areas are positive reponses, a simple thresholding method is not accurate enough since some dark areas should also be included which is related to the shape information. I invited several experts to acquire hunderds of annotations and set up a dataset for training.
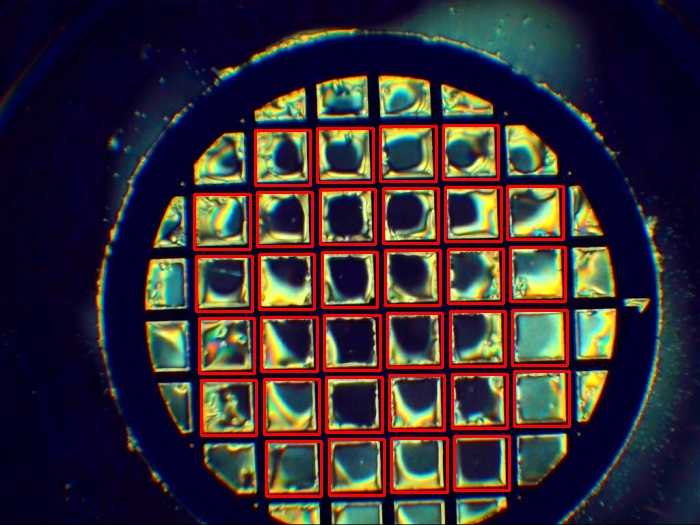
The first diffculty is to detect the regular grids out of the raw microscopy. For this, I used several heuristics such as the size and shape of a regular grid combined with several filters for image processing. And then I could get the bounding boxes shown in Fig.1. The total training set is enlarged to ~2400 after this.
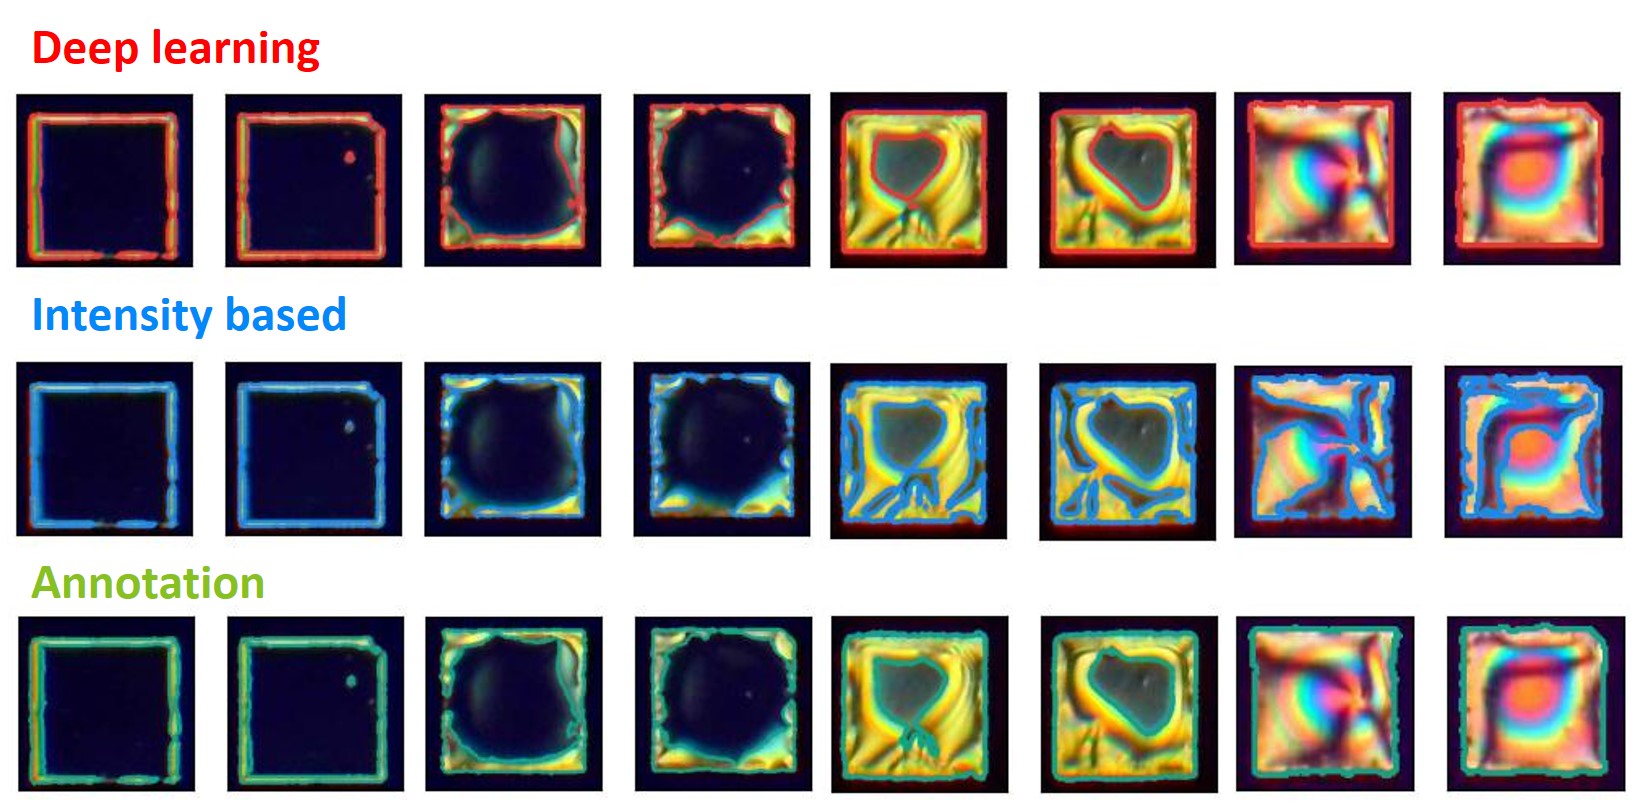
After that, I trained a U-Net with these grids supervised by the corresponding annotations. The network is supposed to segment the positive responses out of the grids. As shown by Fig.2, I can have much better results from U-Net compared to simple thresholding. The positive ratio is defined as the relative area of positive regions to the entire image.
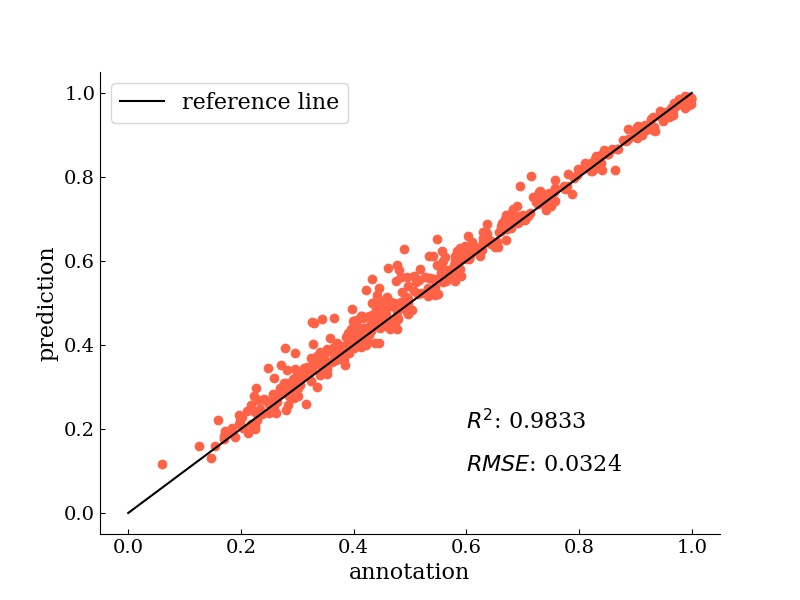
Finally, I calculate the detection score by calculating the average positive ratio of 32 grids in one microscopy. In Fig.3, I compare the ground truth to the predicted score, the results are close to the reference line.
Furthermore, I made a real-time detection software. It takes sequence of images from camera and then perform the operation as shown above. It ouputs the detection as well as segmentation results in the right. And it also shows a trend of score on lower right. An example is shown in the begining of the article.
